INSTRUCTIONS FOR USING THE CUSTOM
WATER QUALITY TOOLS IN ARCGIS
PREPARATION
Before you start make sure you turn the 3D, Spatial analyst extension and any other extension you may need is turned on. The interpolation and animation tools will not work if you don't do this. You may have to repair the files as they may have lost their addresses as result of downloading them to a different folder. The only data you need to repair
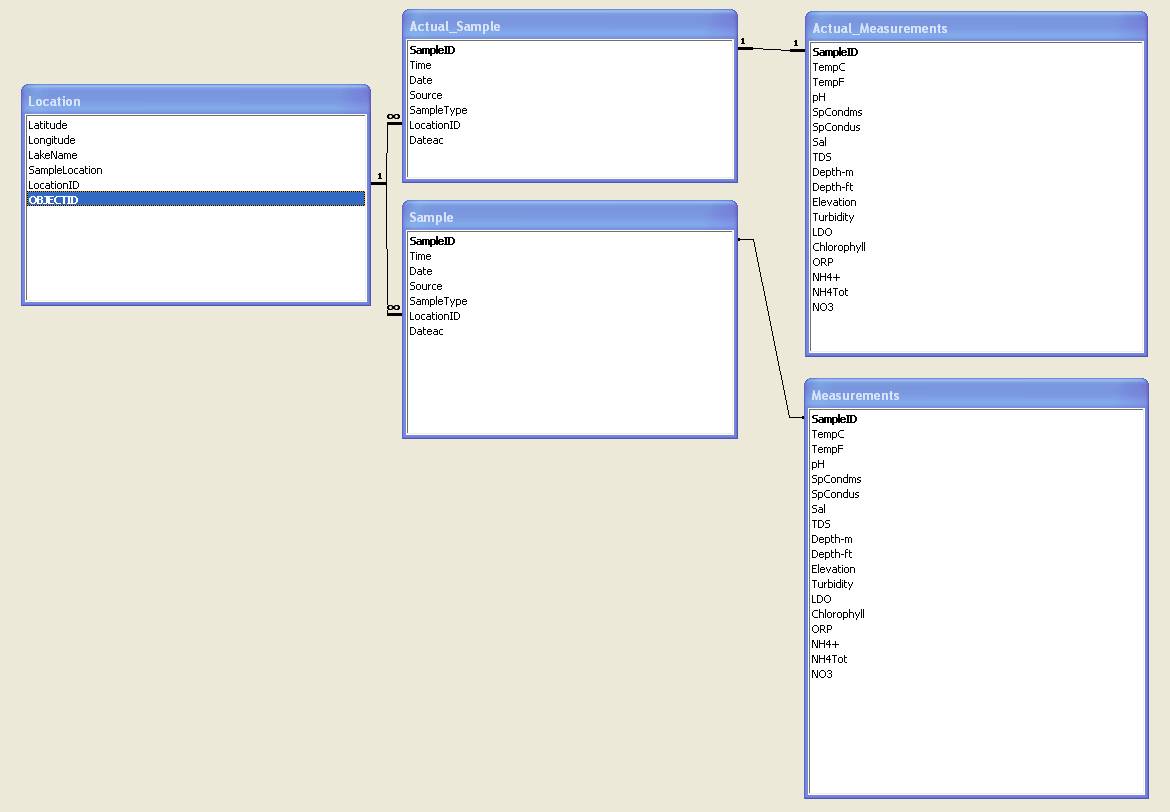
- The database is in access and the schema is shown below. The id’s will be automatically assigned when the .dbf, .csv or excel file is imported into the database. Open the access database for the explanation of naming schema. I have stored the date in a number format so that sorting and querying can be done. The display date has date in correct time format. If you however want to use the table after exporting it to excel you can just change the date column properties back to the date format. The dateac is date stored as a string for labeling.
- To create your own access database, first create a blank access database and name it whatever you want. To import the schema from the sample database provided, click File on the toolbar, Get External Data and the Import. When the dialog box appears browse to the sample database provided and select it. An Import Dialog box appears, Click the Options button. In the Import Tables Panel select Definition Only. Click the Select All button and click OK. You can open the sample database provided to check the kind of data that is added to each field.
- Every single measurement taken has a unique SampleID which is assigned automatically. For each monitoring point you must assign a LocationID.
- When you first open the map, it will have the sample “boundary flat” and the DEM. Remove all of them before you start.
- Measurements table has interpolated values from the Actual_Measurements table.
1. Add the boundary feature of the water
body being studied. This feature can be easily created in ArcGIS by importing a
DEM in which the water boundary can be easily distinguished and digitizing the
water boundary from it. The feature should be named “boundaryflat”.
2. Make sure your boundary is in the
correct coordinate system.
3. To make the map look presentable, you
could add a DEM of the surrounding area to the map to.
- Add
each of the tables in the database. Join the sample table first to the measurements
table and then to the location table.
DESCRIPTION
OF TOOLS AND THEIR USAGE
- The database can be used for multiple reservoirs. Select the reservoir you want to use first before you proceed.
·
Creating
Feature points to Show monitoring points.
This tool allows a user to visualize
the locations where monitoring was done upon clicking the CreateMonitoringPoints
button. It also prompts you to ok labeling the features.

·
Plotting
Vertical profiles
This tool allows a user to plot
vertical profiles at a point on the lake. It allows the plotting of up to two
parameters at the same time so that a comparison can be made. It allows a user
to choose between plotting a line graph and a scatter plot.
Figure 5


·
Plotting
Time Series
This tool plots a time series of a
selected parameter at a certain depth for a specified time period. You can also
plot time series of a profile as shown below. For the point time series you
have the option of choosing as many parameters as you want but in order to
display them in a sensible way parameters that have values that are close
should be chosen together to show variations well.
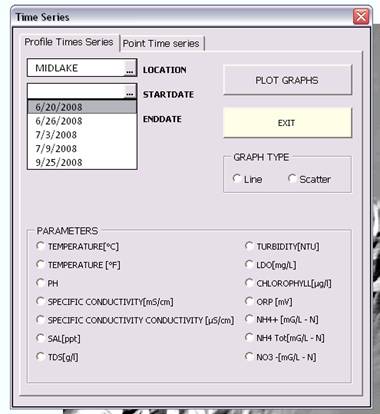
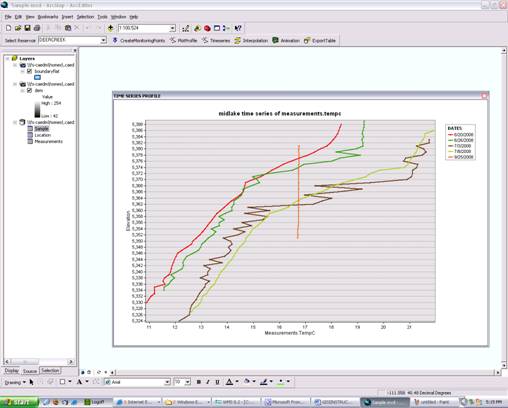

Figure 9
·
Interpolating
data over the water body
The distribution button allows a user to choose a date, a
depth and a parameter to do an interpolation over the entire lake to find out
how the values may be distributed over the entire lake at a certain level to
give a rough idea about how the lake looks overall. The spline
method gave the best interpolation that mimicked what was actually happening on
the lake

·
Animation
The animation tool allows a user to
choose a day and a parameter and using the tool above, a raster is created for
every level on the lake that day. A video is then made by gradually going
through all the rasters at every depth each raster gradually fading into the
next. The time series tab animates the changes that occur at the same level
over time.
·
Select
Table and export
ArcGIS is limited in its ability to model water quality
parameters. This feature allows a user to get part of the database to do some
analysis.

I have a Scratch file Geodatabase where all intermediate data for the processes are stored. Make sure you empty it periodically to create room or else you might get an error when it is full. I am also working on making the monitoring points interactive so that it will automatically give you the choice of plotting graphs.
CONTACT
If any problems
are encountered during the usage of these tools please feel free to contact me
with them. All other comments and suggestions are welcome.
CALEB AMOA
BUAHIN